Sean Ellis is the growth architect behind Dropbox and Eventbrite who has entirely reframed product-market fit (PMF). Analyzing user data from over a hundred startups had him identify PMF as a consistent predictor of success.
He suggested asking active users one question: “How would you feel if you could no longer use this product?”
After benchmarking nearly a hundred startups, Ellis found that companies where over 40% of users answered were very disappointed and almost always had strong traction. Companies below that threshold almost always struggled to grow. But, how to measure it based on the signals your product shows?
Let’s explore.
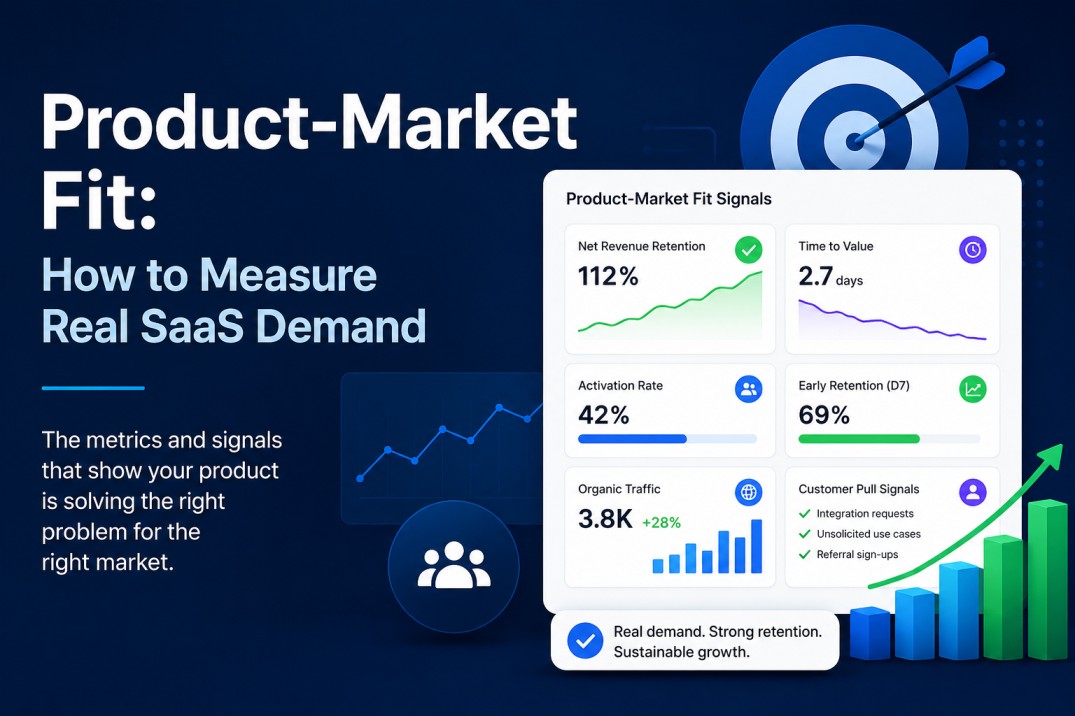
Product-market fit is measured by looking beyond basic growth numbers and tracking whether users consistently find value in the product. The strongest PMF signals include high net revenue retention, fast time to value, strong early activation, clear retention-driving milestones, organic or referral-led demand, repeated integration requests, unexpected use cases, and customers pulling the product roadmap in a clear direction. Together, these signals show whether the market is genuinely adopting the product or whether growth is being forced through paid acquisition and surface-level metrics.
Table of Contents
Tracking the Net Revenue Retention
Net Revenue Retention (NRR) measures how an existing customer base generates revenue over a set period. It shows whether current users find enough value to remain and increase their spending.
A 2024 SaaS Benchmarks Report shows that SaaS companies with high NRR grow 2.5x faster than those with low NRR.
Measure the NRR by isolating a specific cohort of customers that’s present at the beginning of the period. Don’t account for new customers; otherwise, it distorts the results because early expansion or churn behavior differs from that of established users.
Calculate the monthly NRR figure using this formula:
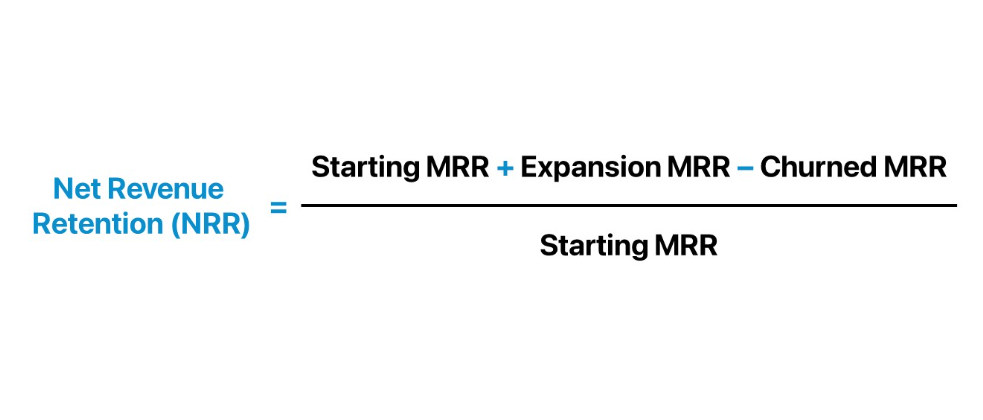
Rolling this calculation on a rolling monthly basis can identify immediate changes, whereas looking at a 12-month trend line indicates whether the product is gaining or losing long-term relevance.
Avoid using aggregate numbers
A healthy aggregate NRR, such as 105%, can be misleading, for it can hide a disparity. What if enterprise accounts might retain at 120% while smaller accounts churn at 85%!
It’s not something that truly represents a product-market fit. In fact, it’s a rather shaky dependency on a thin layer of growing accounts. Relying on a blended average encourages a product strategy that fails to serve either group effectively, which is why some teams run a technical debt audit to uncover hidden inconsistencies in reporting and segmentation logic.
As these systems become more complex, many teams also rely on Webflow-focused development teams to standardize data flows, improve system architecture, and reduce inconsistencies across their tech stack.
That’s when you can use customer segmentation by company size or number of accounts.
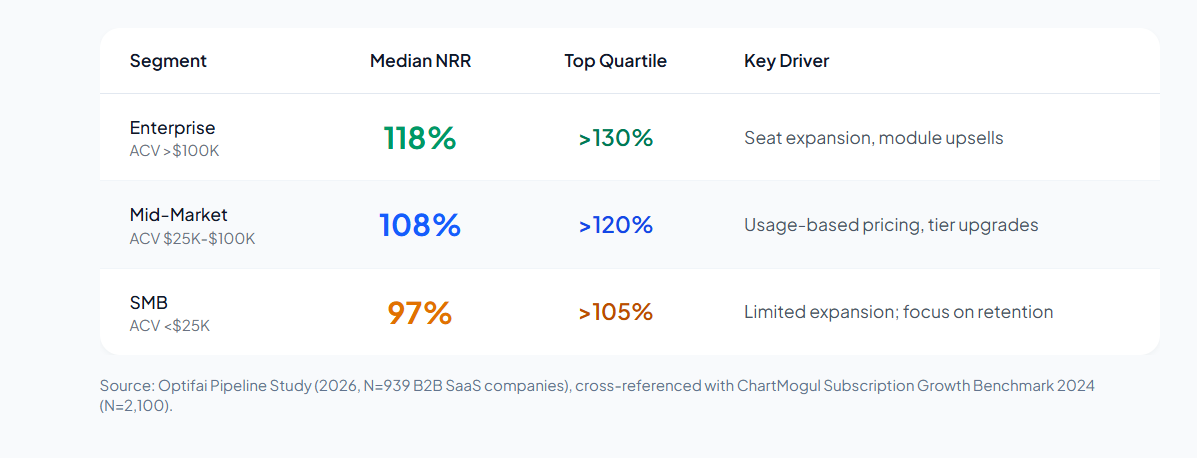
Optifai’s NRR benchmark data illustrates this well. Before drawing any conclusions about PMF from your NRR number, disaggregate it by customer segment. The answer is almost always different from what the aggregate suggests.
Measuring Time to Value
For the average baseline of activation, you’d use only the sum of users who complete an onboarding flow. But it doesn’t consider those who complete the setup wizard and are still not able to experience the product’s actual benefit (the ‘aha moment).
Trello updated its onboarding strategy to address decision fatigue around the blank canvas. They found that users presented with a preconfigured board, rather than a blank one, reached their first success moment (adding a task) within seconds of signing up, thereby improving time-to-value (TTV).
TTV is a more practical indicator of product-market fit because it measures how long it takes a user to reach the point where the product solves a tangible problem for them.
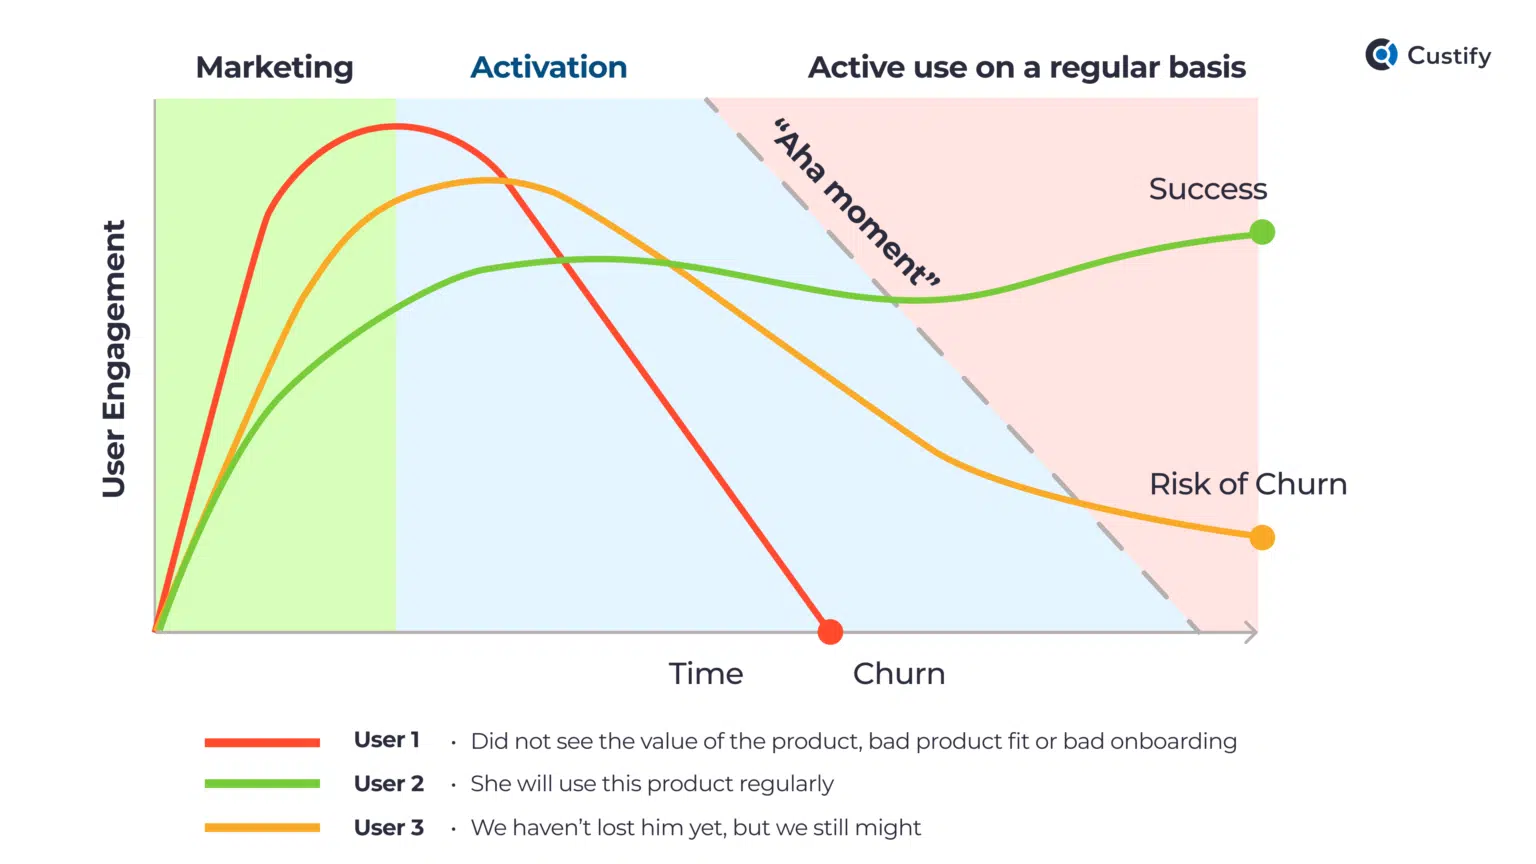
What you eventually want is to drive the aha moment with products that deliver it in the first week, and retain significantly better. It’s also what Amplitude’s 2025 benchmark report found: 69% of products with strong early activation were strong three-month retention performers.
Missing out on the activation benchmark
Even with a healthy onboarding process, a benchmark of 40% for activation rate within the first seven days indicates. Anything below 30% suggests that users are either encountering technical friction or failing to perceive the product’s value, which hinders quick progress.
The data from Userpilot shows that these expectations vary widely by the category of your SaaS product. Like, if you’re selling CRM and sales tools, then a benchmark activation rate of 42.6% with a median time to value of 28 hours sets a good base.
In contrast, HR products take nearly four days to reach the same milestone, with a much lower activation rate of 8.3%.
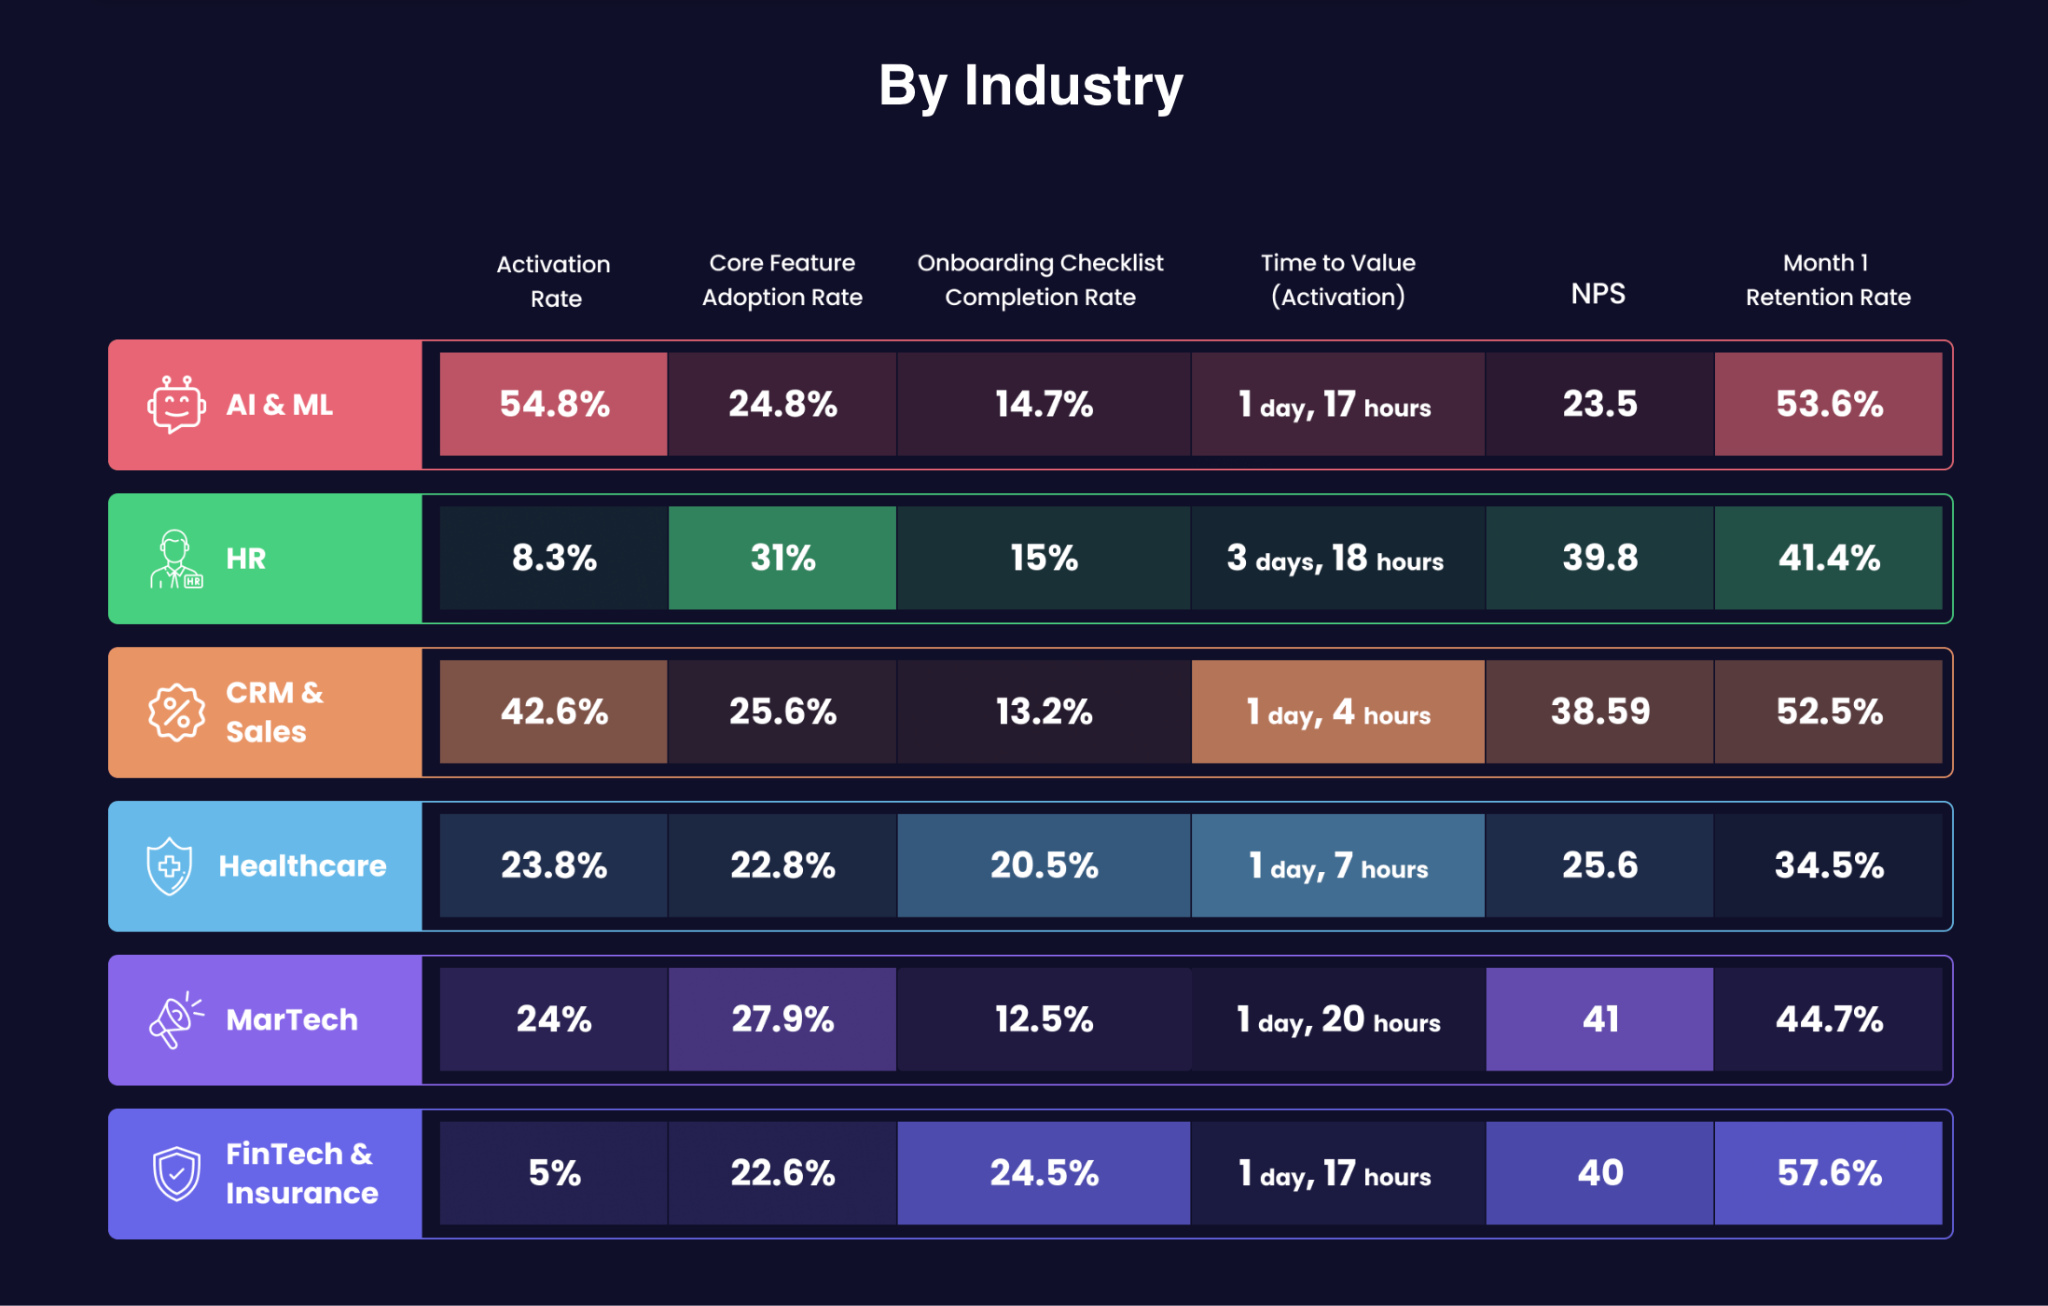
Knowing these vertical-specific benchmarks helps differentiate between a standard adoption curve and a genuine product hurdle. If the median time to activation exceeds two weeks, the friction is likely high enough to obscure whether the product has actually achieved market fit.
Streamlining the path to value
Improving these numbers requires precisely identifying specific actions that correlate with long-term retention, which must be defined precisely.
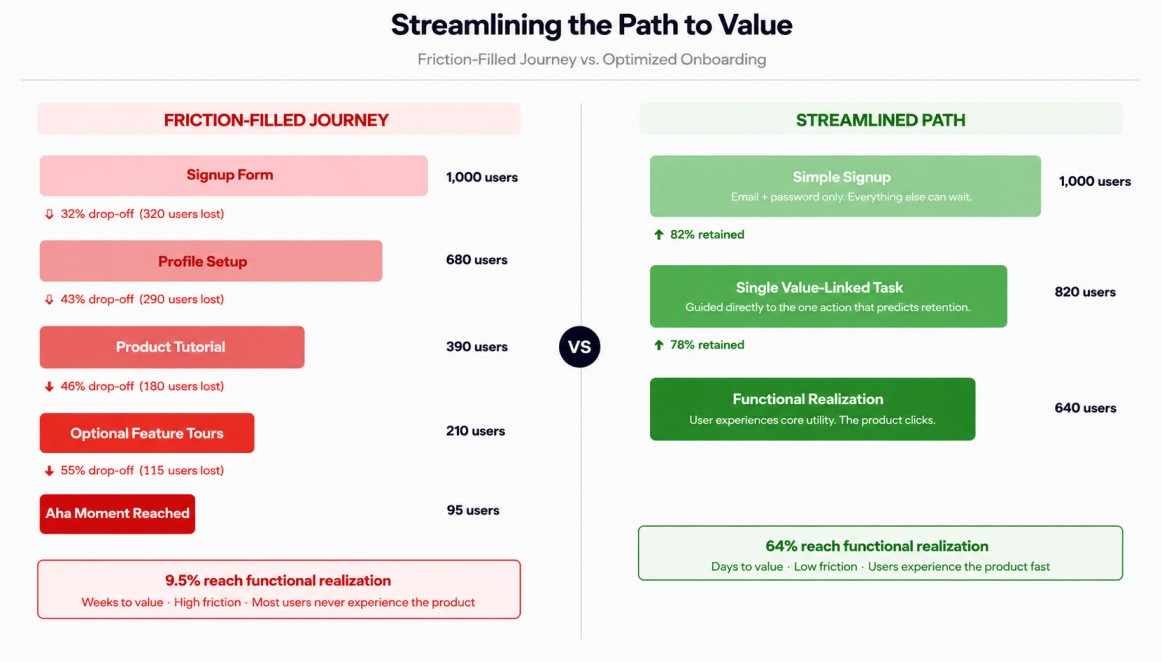
Path to value for a frictionless journey
By analyzing users who have remained active for at least six months, teams can identify the single task — such as logging a first follow-up call or creating a second project — that signals the transition from a casual observer to a functional user. Choosing the right analytics stack matters here too. Teams that find their current tool limiting may look into some cool Omni Analytics alternatives that offer more flexible metric tracking and visualization out of the box.
Once this milestone is identified, the next step is to map the percentage of signups who reach it within the first week.
Knowing exactly where users abandon the journey allows for a targeted focus on removing unnecessary steps. Every field in a form or screen in a tutorial that does not directly contribute to this realization is a potential source of loss.
Redesigning the flow to eliminate these distractions ensures that the user reaches the product’s core utility as quickly as possible.
Watch Out for the Qualitative But Unsolicited Pull
The market can pull your product in different directions, where users find different use cases for your product. It’s a strong indicator that organic growth outpaces your ability to manage the product’s direction.
Some common indicators are when feature requests cluster around use cases you didn’t design for or when you get support tickets asking about the integrations you haven’t built yet.
There’s a reason behind such a pull: organic or referrals-driven growth. Those leads convert from MQL to SQL at 51%, nearly double the 26% conversion rate of paid advertising leads because they arrive with built-in intent.
These are the users who’ve already researched the problem and found your product through a peer or a search result. Post which, they’ve decided to try it before your sales team makes contact. When that type of lead starts showing up with increasing frequency, the market is telling you something about your fit.
To capture the pull signals —
Check for integration demands in support calls
When customers start asking for connections to tools you haven’t integrated with, they’re telling you where the product needs to go next.
Use customer service solutions to log these requests in a shared tracker, such as a simple spreadsheet or a tag in your support tool, like Intercom or Zendesk. Product teams can then use those requests for future feature implementation.
Explore use cases
Do you know that Asana can be used as a CRM? That’s a use case right there for a work management tool. Similarly, you may come across user-generated content where your tool can have multiple use cases.
That’s a pull signal from a market segment you haven’t officially targeted yet.
Look at how customers are actually using the product, not how you designed it to be used. The gaps between intended use and actual use highlight the real product-market fit.
For starters, review session recordings using tools like FullStory or Hotjar. Best — let your customer support ask: “What’s the one thing you use our product for that we probably didn’t expect?”
Review the source of the lead
Keep a log of new leads by source in your CRM. Often, this needs labeling them under inbound-organic, inbound-paid, outbound-SDR, outbound-founder, referrals, and others. Also, keep reviewing the mix monthly.
If you see a rising share of organic and referral leads, then it is a clear sign of PMF in your pipeline. Because those leads arrived without you having to spend to acquire them. Now, if that share is flat or declining while paid leads grow, your growth is being bought, not pulled.
The Zapier’s Case of Product-Market Pull
Zapier noticed a pattern where users were constantly asking for specific app connections. Instead of building one large feature, they followed the pull and built thousands of small integrations.
The product roadmap was shaped almost entirely by what customers requested in support and on forums.
When it came time to build Zapier for Teams, the same dynamic played out. As Wade Foster, CEO of Zapier, described in an interview with Intercom:
“It was our own customer base just pulling us into this new product, Zapier for Teams… they already love what we have, they’re already sold on it, but they just need a few workflows that better help them collaborate with other folks in their organization…. You just have to say, ‘Hey, I want to make this better for you. What do you want?’ They’ll tell you.”
That’s what unsolicited pull looks like in practice. The customers were already inside the product, already finding value, and already telling Zapier what to build next.
The company didn’t need to guess at PMF for Teams. The existing user base confirmed it before a single line of code was written.
Conclusion
Measuring product-market fit requires looking beyond surface-level metrics and tracing the product’s impact on end-users. Again, metric monitoring must also be spread-checked from time to time, because what worked six months ago can quietly stop working if no one is watching the right numbers.
Start with one signal that feels closest to where your product is today, run it for 30 days, and let what surfaces guide the next decision.
What is product-market fit?
Product-market fit means that users consistently find enough value in a product to keep using it, expand their usage, or recommend it to others.
The article explains that PMF should be measured through real user behavior, revenue retention, activation, time to value, organic demand, and customer pull signals.
How did Sean Ellis measure product-market fit?
Sean Ellis suggested asking active users how they would feel if they could no longer use the product.
After benchmarking many startups, he found that companies where more than 40% of users answered “very disappointed” usually showed strong traction.
Why is net revenue retention important for measuring product-market fit?
Net revenue retention shows whether an existing customer base continues to generate revenue over time.
The article explains that strong NRR can indicate that current users find enough value to stay, expand usage, and increase spending.
Why can aggregate NRR be misleading?
Aggregate NRR can hide major differences between customer segments.
The article gives the example of enterprise accounts retaining strongly while smaller accounts churn, which can make the blended number look healthier than the product actually is for every segment.
What is time to value in product-market fit analysis?
Time to value measures how long it takes a user to reach the point where the product solves a real problem for them.
The article says this is more useful than simply tracking whether users complete onboarding, because users need to reach the product’s actual benefit.
What activation benchmark can indicate friction?
The article says that an activation rate below 30% within the first seven days can suggest technical friction or a failure to perceive product value.
It also explains that activation benchmarks vary by SaaS category, so teams should compare performance against their specific vertical.
What are product-market pull signals?
Product-market pull signals appear when users start asking for integrations, discovering unexpected use cases, or arriving through organic and referral channels.
The article explains that these signals show the market may be pulling the product in a direction the team did not originally design for.
How should teams start measuring product-market fit?
The article recommends starting with one signal that feels closest to the product’s current stage and tracking it for 30 days.
What surfaces from that measurement should guide the next product or growth decision.

Andrej Fedek is the creator and one-person owner of three blogs: InterCool Studio, CareersMomentum, and Bettegi. As an experienced marketer, he is driven by turning leads into customers with White Hat SEO techniques. Besides being a boss, he is a real team player with a great sense of equality.